Quick Start Guide: Explore the JetForcer IDE for Salesforce
Content:
- Familiarize yourself with basics capabilities of chosen JetBrains IDE.
- Create a project.
- Create a new metadata.
- Explore changes in the project sources.
- Deploy to org.
- Retrieve metadata from org to project.
- Configure trace flags.
- Create and run tests.
- Explore debug logs with the Log Manager.
- Start debug session.
Step 1: Familiarize yourself with JetBrains IDEs
JetBrains provides useful short guides aim to help you familiarise with IDE. For example, see WebStorm and IntelliJ IDEA guides.
JetBrains IDEs have no perspectives like other IDEs do (e.g. Eclipse). You may do different tasks without manually switching among different workspace layouts. The IDE follows your context and brings up the corresponding tools automatically. So, the shortcuts and actions stay the same all the time.
Working with Tool Windows
Tool Windows are attached to the bottom and sides of the main IDE window. These auxiliary windows provide access to typical Force.com development tasks. These include executing anonymous code, query editor, integration with VCS (Version Control Systems), viewing debug logs, source code search and navigation, running and debugging, and many other Salesforce specific tasks.
Use the View | Tool Windows menu to show or hide the tool windows.
Step 2: Create a project
To create a new Salesforce project from organization, follow these steps:
- Do one of the following:
- On the Welcome screen, click the link Create New Project.
- On the main menu, choose File | New Project.
- In the opened dialog box, select Salesforce project type and enter the necessary information.
Information Description Location: Specify project location. Account: Select or create new Salesforce account. Stored Set: Allows to configure predefined dialog states (e.g. Apex and Visualforce in Force.com IDE). Managed: Choose managed packages to download to project. Metadata Checkbox Tree: Choose metadata to download to project sources. - Click Create, when ready. IDE will connect to the org associated with the specified account and copy specified metadata into the project sources in the appropriate folders.
Step 3: Create a new metadata.
JetForcer provides various ways to create a new file from a template. The created file will be automatically opened in the editor.
Our aim is to create class and trigger that populates the Description field on the Accounts tab with the word “Hello, World!”.
- Create
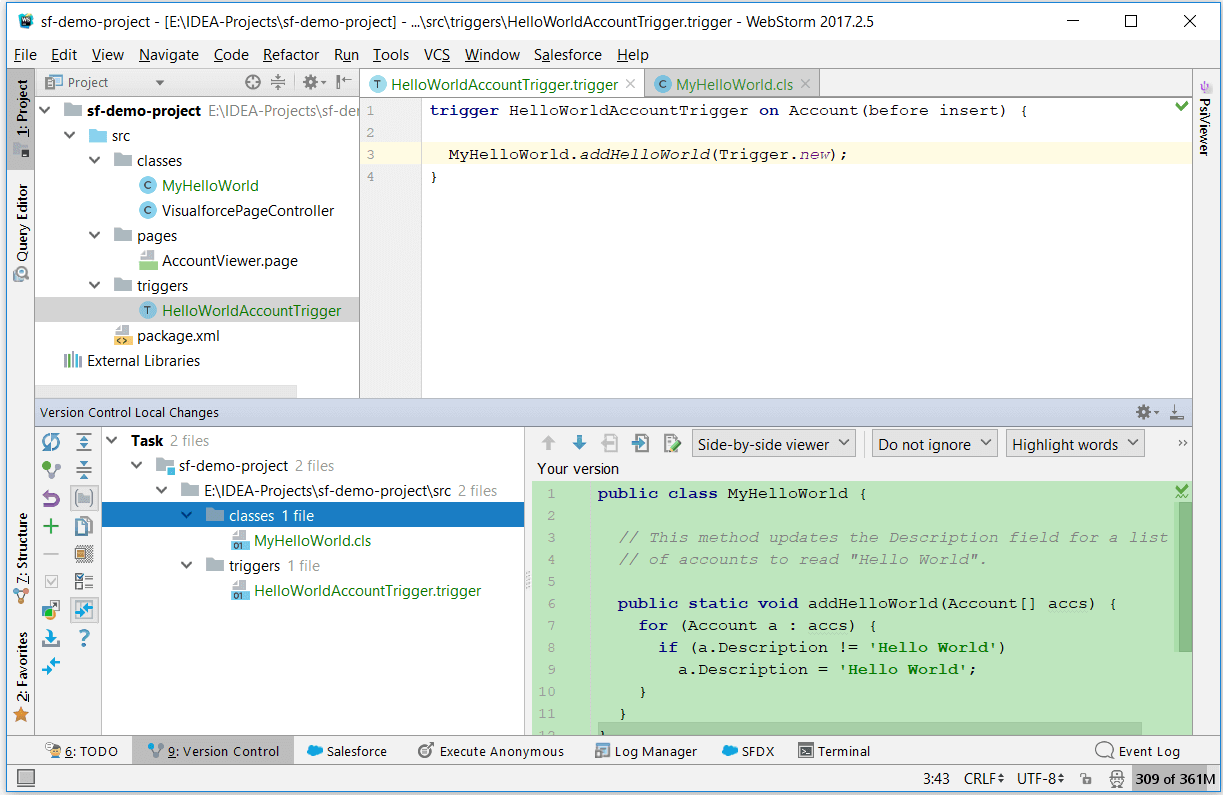
MyHelloWorld.clsclass and replace the auto-generated text with the following:public class MyHelloWorld { <i// This method updates the Description field for a list // of accounts to read "Hello, World!". public static void addHelloWorld(Account[] accs) { for (Account a : accs) { if (a.Description != 'Hello, World!') a.Description = 'Hello, World!'; } } } - Next, create
HelloWorldAccountTrigger.triggertrigger that callsMyHelloWorld.clswhenever an Account record is created.trigger HelloWorldAccountTrigger on Account (before insert) { MyHelloWorld.addHelloWorld(Trigger.new); }
Step 4: Explore changes in the project sources.
There are several methods to keep track of the changes that you introduce to the source code. For complete details read Viewing Changes in Source Code documentation. Version Control tool window is a good choice for this purpose.
Step 5: Deploy to org.
Deploy created metadata to org in either of two ways, when ready:
- By using Deploy Single File (Selection) - commonly used for quick deploy right from the editor by pressing shortcut.
- By using Bulk Deploy with ApexVCS - commonly used for deploying multiple files at once.
Step 6: Retrieve metadata from org to project.
There are different ways to sync/retrieve project files with your Salesforce organization.
- By using Retrieve/Update Single File(Selection) - commonly used for quick sync with Salesforce org right from the editor by pressing shortcut.
- By using Retrieve Multiple Files - commonly used for bulk update metadata from Salesforce org.
Step 7: Configure trace flags.
Next, configure trace flags by using Trace Flags tab in Log Manager tool window. It necessary for generation debug logs after user activity (running tests, execute anonymous code etc).
Step 8: Create and run tests.
In this section, you learn how to quickly create and run a simple unit test.
NOTE: at least 75% of your code must be covered by tests before you can deploy it to a production Salesforce org.
Generally, JetForcer runs tests by running the Run Configurations you have created. For more usability, the Run commands are provided in certain context menus. For example, these commands are available for a test class or even a directory in the Project View. Moreover, you are able to start testing right from the editor where you are currently working.
Create HelloWorldTest.cls test for the HelloWorld.cls class.
@IsTest
private class MyHelloWorldTest {
    // Simple test of the method
    // MyHelloWorld.addHelloWorld(Account[])
    @IsTest
    static void test_addHelloWorld() {
        // Set up test data set
        Account testAcct1 = new Account();
        Account testAcct2 = new Account(Description = 'Foo');
        Account[] accts = new Account[] { testAcct1, testAcct2 };

        // Execute code with test data
        MyHelloWorld.addHelloWorld(accts);  // call

        // Confirm results
        System.assertEquals('Hello World', accts[0].Description);
        System.assertEquals('Hello World', accts[1].Description);
    }

    // Simple test of the trigger helloWorldAccountTrigger
    @IsTest
    static void test_helloWorldAccountTrigger() {
        // Set up test data set
        Account testAcct1 = new Account(Name='One');
        Account testAcct2 = new Account(Name='Two', Description = 'Foo');
        Account[] accts = new Account[] { testAcct1, testAcct2 };

        // Execute trigger with test data set
        insert accts;

        // Confirm results
        Account[] acctQuery = [SELECT Description FROM Account WHERE Id = :accts[0].Id OR Id = :accts[1].Id];
        System.assertEquals('Hello World', acctQuery[0].Description);
        System.assertEquals('Hello World', acctQuery[1].Description);
    }
}
Step 9: Explore debug logs with Log Manager.
Use the Logs tab in the Log Manager tool window to access debug logs.
Step 10: Start debug session.
Log Debugger from JetForcer is a new comfortable method to explore the information available in the log.
Here are a few of available features:
- Variables View - A handy way to examine the values stored in the VARIABLE_SCOPE_BEGIN and VARIABLE_ASSIGNMENT log events available in the current debug context (METHOD_ENTRY, CONSTRUCTOR_ENTRY etc.)
- Step-By-Step Execution - Build code execution flow and walk through it with STATEMENT_EXECUTE log events and their context (METHOD_ENTRY, CONSTRUCTOR_ENTRY etc.)
- Breakpoints - Allows to quickly jump to the desired STATEMENT_EXECUTE event by skipping all previous data.
- Watches: - Create specific System.debug(JSON.serialize(Object)) method call for detailed exploring of an object instance in Variables View.
That's about it!
Here is a very concise overview of some JetForcer capabilities, just to give you a quick start. For complete details, see Features Description page.
Enjoy developing with JetForcer and JetBrains IDEs!